- Gold price gains on Tuesday amid poor risk sentiment.
- Fed-Trump standoff creates chaos in the markets, adding more uncertainty.
- Investors await catalysts like US Core PCE and US GDP data to provide further impetus.
Gold price gained on Tuesday during the early New York session as investors evaluated headlines from Washington against upcoming macroeconomic releases. The yellow metal remains well bid above the recent lows as traders look forward to a decisive week marked by policy uncertainty and US inflation and GDP data.
–Are you interested in learning more about crypto robots? Check our detailed guide-
The political standoff between the Federal Reserve and President Trump remains the key driver for gold prices today. Markets are closely assessing whether the US President will be able to remove Fed Governor Cook. Such a move would give Trump a notional majority among voting members of the FOMC. However, this would undermine the autonomy of the central bank and signal an aggressive rate cut path, which could push gold further up.
The interest rate curve is another key indicator to watch. Market implied cuts are priced into the front end of the curve. However, the question arises whether those odds will persist or fade out if policymakers change their stance against speculation.
Other than macro drivers, ETF flows also matter. The inflows remain steady while futures positioning stays cautious, suggesting much room for re-engagement if the narrative turns clearly dovish. Moreover, central bank buying remains constant, especially from emerging markets, to diversify from the dollar.
Attention will turn to the US macroeconomic releases, including the Core PCE Index and the GDP Q2 revision. A sustained slowdown in inflation would validate the case for easing, reinforcing the demand for gold. Conversely, resilient data could temper the expectations and limit the bullion rally.
Gold price technical analysis: Bulls to conquer $3,400
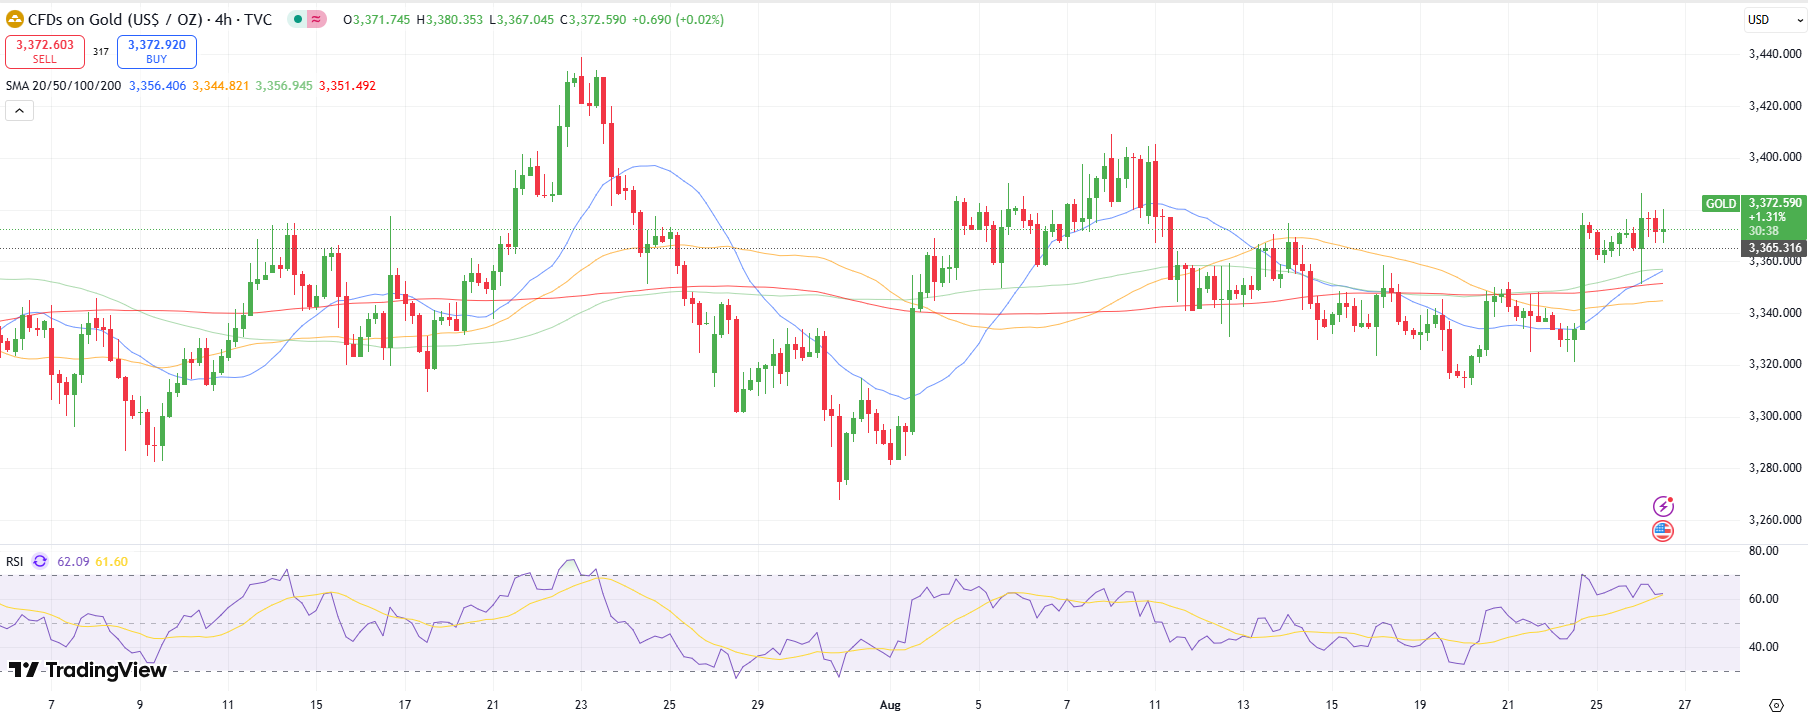
The 4-hour chart for gold shows no clear bias as the markets consolidate gains. The key moving averages remain in a cluster at $3,340-55 area. The price remains shy of $3,400 level, which is key for the buyers to continue the upside momentum. The 20- and 100-period MAs are converging to form a bullish crossover. If confirmed, it could trigger buying pressure as well.
–Are you interested in learning more about buying Dogecoin? Check our detailed guide-
On the flip side, falling below the key moving average cluster could alter the scenario and open the door for more losses towards $3,300. The next support level emerges at $3,260. The RSI indicates a bullish trend but lacks conviction.
Looking to trade forex now? Invest at eToro!
68% of retail investor accounts lose money when trading CFDs with this provider. You should consider whether you can afford to take the high risk of losing your money.
