- The GBP/USD weekly forecast indicates weaker growth in the UK.
- Treasury yields soared after Trump announced higher tariffs on several countries.
- Next week, the US will release crucial inflation and retail sales figures.
The GBP/USD weekly forecast indicates weaker growth in the UK, which has pushed up BoE rate cut expectations.
Ups and downs of GBP/USD
The GBP/USD pair had a bearish week as the dollar gained with US Treasury yields. Meanwhile, the pound dropped after downbeat UK GDP figures.
–Are you interested in learning more about Forex robots? Check our detailed guide-
Treasury yields soared after Trump announced higher tariffs on several countries, including Canada, Brazil, and Japan. If these tariffs take effect, they will hike import prices and drive inflation higher. This would force the Fed to maintain high borrowing costs.
Elsewhere, data on Friday revealed that the UK economy contracted by 0.1% compared to the forecast of a 0.1% expansion. The report increased pressure on the Bank of England to cut interest rates.
Next week’s key events for GBP/USD
Next week, the US will release crucial inflation and retail sales figures. Meanwhile, the UK will release inflation and employment numbers. The US inflation figures will show whether Trump’s tariffs have increased price pressures. If so, the Fed might remain cautious about rate cuts. However, if inflation is softer than expected, it will solidify rate cut expectations.
On the other hand, the UK inflation numbers will shape the outlook for Bank of England rate cuts. Traders will also watch to see the state of the UK labor market.
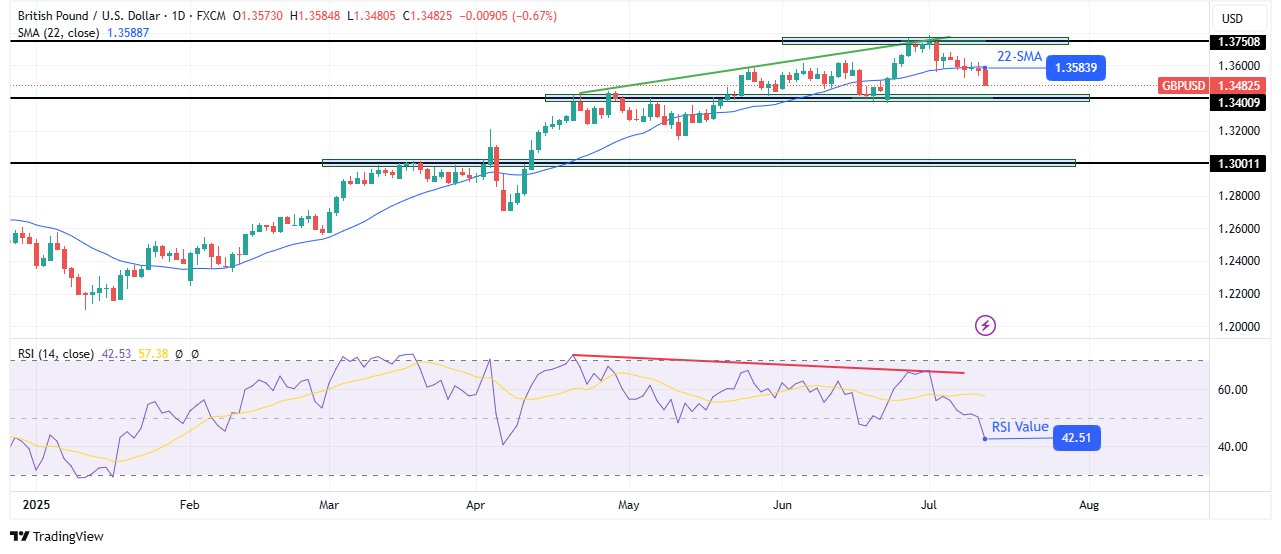
GBP/USD weekly technical forecast: Bears break below SMA after RSI divergence

On the technical side, the GBP/USD price has broken below the 22-SMA after showing weakness in the rally. The break indicates a bearish shift in sentiment. At the same time, the RSI has crossed below 50, showing that bearish momentum is stronger.
–Are you interested in learning more about XRP price prediction? Check our detailed guide-
Previously, the price was trading in a solid bullish rally, making higher highs and lows. However, the price started puncturing the SMA, a sign that bears were gradually getting stronger. At the same time, while the price made higher highs, the RSI made lower ones. This resulted in a bearish divergence, signalling weaker momentum.
Consequently, bears made a strong break below the SMA. However, to confirm a new trend, the price must maintain its position below the 22-SMA. Additionally, it must start making lower highs and lows. That means breaking below the 1.3400 support.
Looking to trade forex now? Invest at eToro!
68% of retail investor accounts lose money when trading CFDs with this provider. You should consider whether you can afford to take the high risk of losing your money.
