- The USD/CAD weekly forecast shows renewed tariff concerns.
- Trump announced a 35% tariff on Canadian goods.
- Canada released a robust employment report.
The USD/CAD weekly forecast shows renewed tariff concerns after Trump announced a 35% tariff on Canadian imports.
Ups and downs of USD/CAD
The USD/CAD pair had a bullish week as the Canadian dollar collapsed after Trump announced a 35% tariff on Canadian goods. At the same time, the dollar rebounded as Trump renewed his tariff campaign.
–Are you interested in learning more about Forex robots? Check our detailed guide-
However, there was some downward pressure on the dollar after FOMC minutes showed a higher chance of a rate cut later this year. Meanwhile, Canada released a robust employment report. Job growth was stronger than expected, and the unemployment rate dropped to 6.9%.
Next week’s key events for USD/CAD
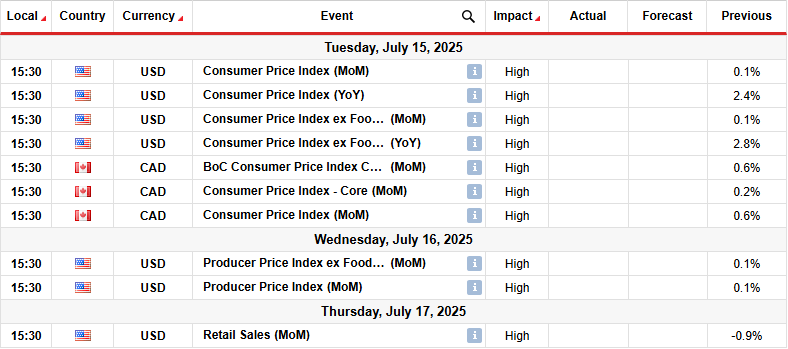
Next week, market participants will pay attention to inflation and retail sales figures from the US. Meanwhile, Canada will release data on inflation, shaping the outlook for Bank of Canada rate cuts.
The US inflation report will show whether price pressures are still on a downtrend. If so, it will give the Fed more confidence to lower borrowing costs later in the year. On the other hand, if inflation is higher than expected, it could raise concerns about the impact of tariffs on price pressures. Such an outcome would lower rate cut expectations, boosting the dollar.
USD/CAD weekly technical forecast: RSI divergence triggers weak trendline break
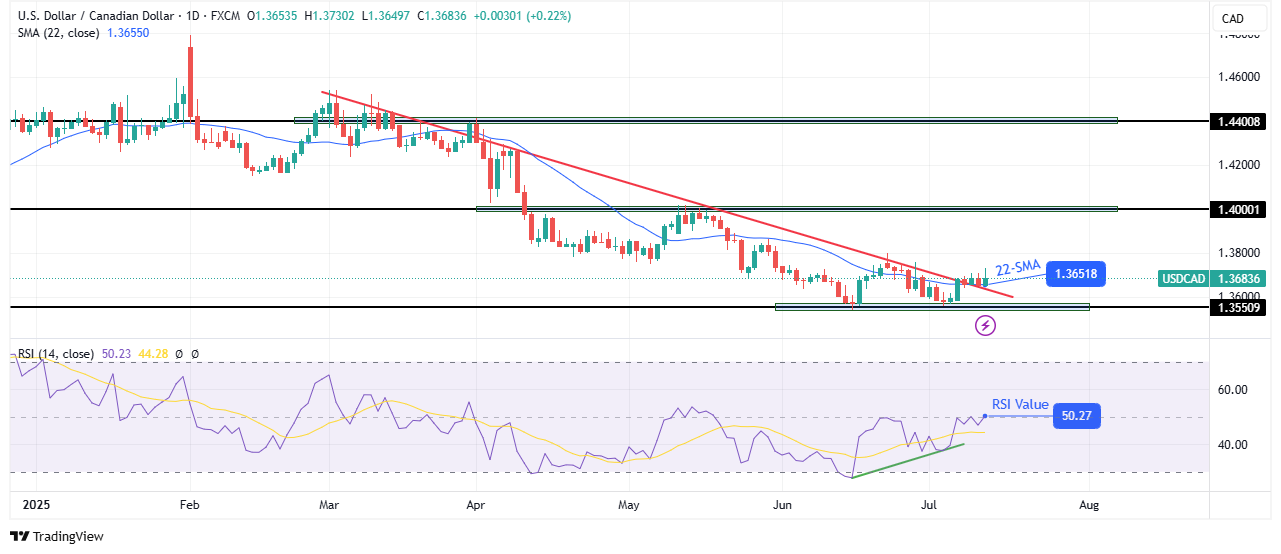
On the technical side, the USD/CAD price has made a weak break above the 22-SMA and its resistance trendline. The price trades slightly above the 30-SMA, and the RSI is above 50, suggesting a bullish bias.
–Are you interested in learning more about XRP price prediction? Check our detailed guide-
For a long time, the price has maintained a bearish trend, making lower highs and lows. However, the decline slowed at the 1.3550 support, where the price made a double bottom. Meanwhile, the RSI made a bullish divergence, indicating weaker bearish momentum. This allowed bulls to challenge the resistance zone comprising the 22-SMA and the trendline.
The price broke above. However, the break was weak as bulls have made small-bodied candles. Next week, bulls will have to show stronger momentum to confirm the break. If this happens, it will confirm a shift in sentiment. On the other hand, if they fail to sustain a move above the trendline, the price will drop to retest the 1.3550 support.
Looking to trade forex now? Invest at eToro!
68% of retail investor accounts lose money when trading CFDs with this provider. You should consider whether you can afford to take the high risk of losing your money.
